> ## Documentation Index
> Fetch the complete documentation index at: https://signalschools.co.uk/docs/llms.txt
> Use this file to discover all available pages before exploring further.
# Creating Reports
> Filter, export, and save reports from your safeguarding data. Download Excel files, save report configurations for reuse, and share chart images.
Signal makes it straightforward to turn your safeguarding data into reports you can share with governors, Ofsted inspectors, and local authorities. Filter your data, choose how to display it, and export or save the results.
 ## Filtering data
Start by narrowing down to the data you want to report on:
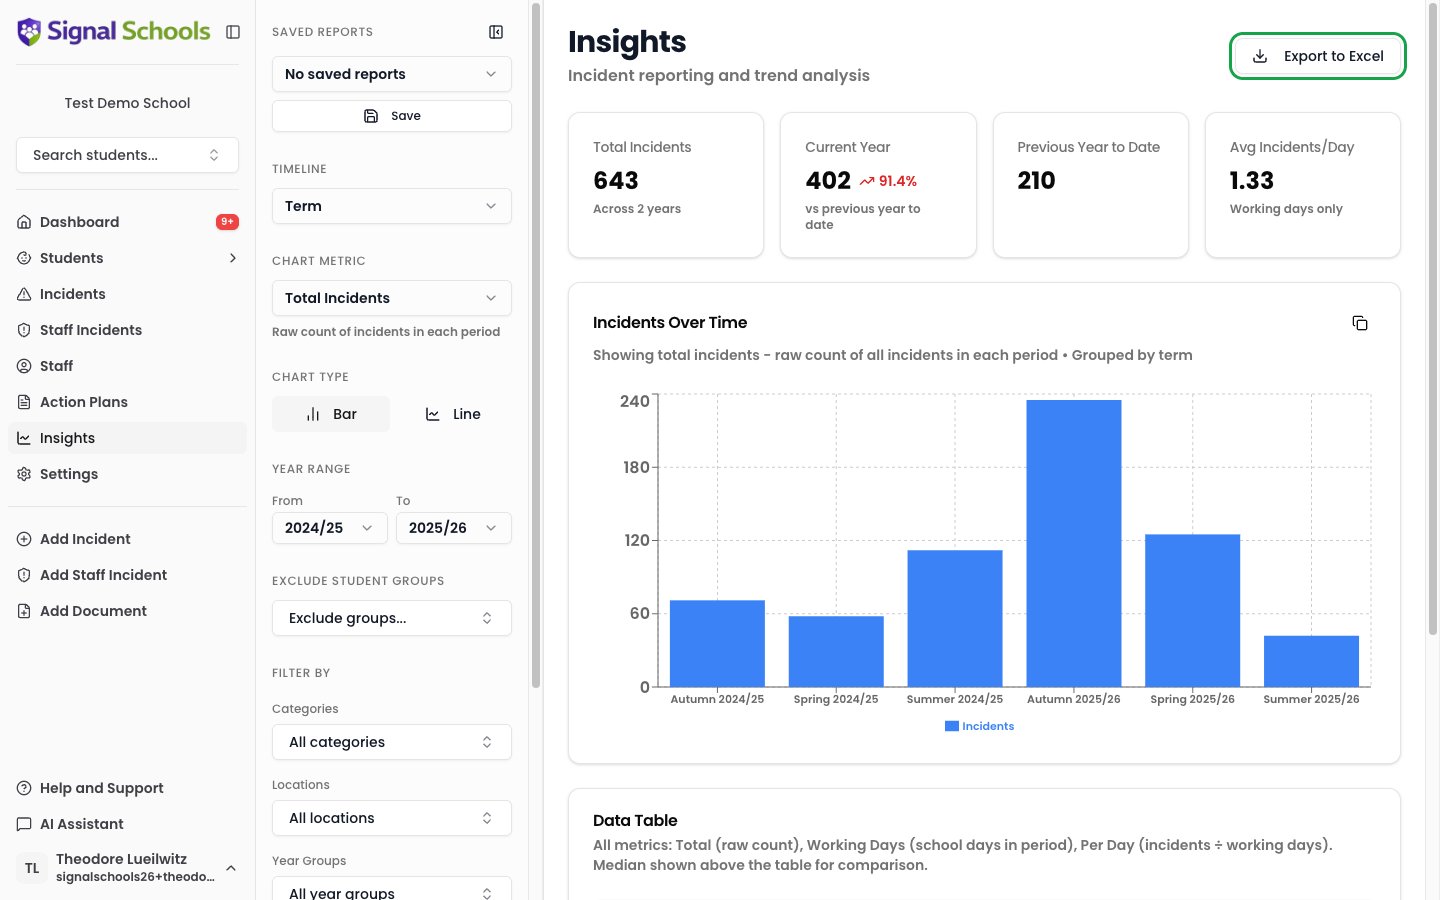
* **Year range** — select the academic years to include using the **From** and **To** year pickers, such as from 2023/24 to 2025/26.
* **Date range** — narrow further to a specific time period within those years, such as a term, half-term, or custom dates.
* **Categories** — include only specific types of concern, or leave blank to include all categories.
* **Year groups** — focus on particular year groups or compare across the school.
* **Student groups** — report on specific groups, such as Pupil Premium, SEN, or Children in Care.
Combine filters to answer specific reporting questions. For example, select "Autumn Term" + "Neglect" + "Year 3" to see neglect incidents for Year 3 during the autumn term.
## Chart types
Toggle between two visualisation styles to find the most effective presentation:
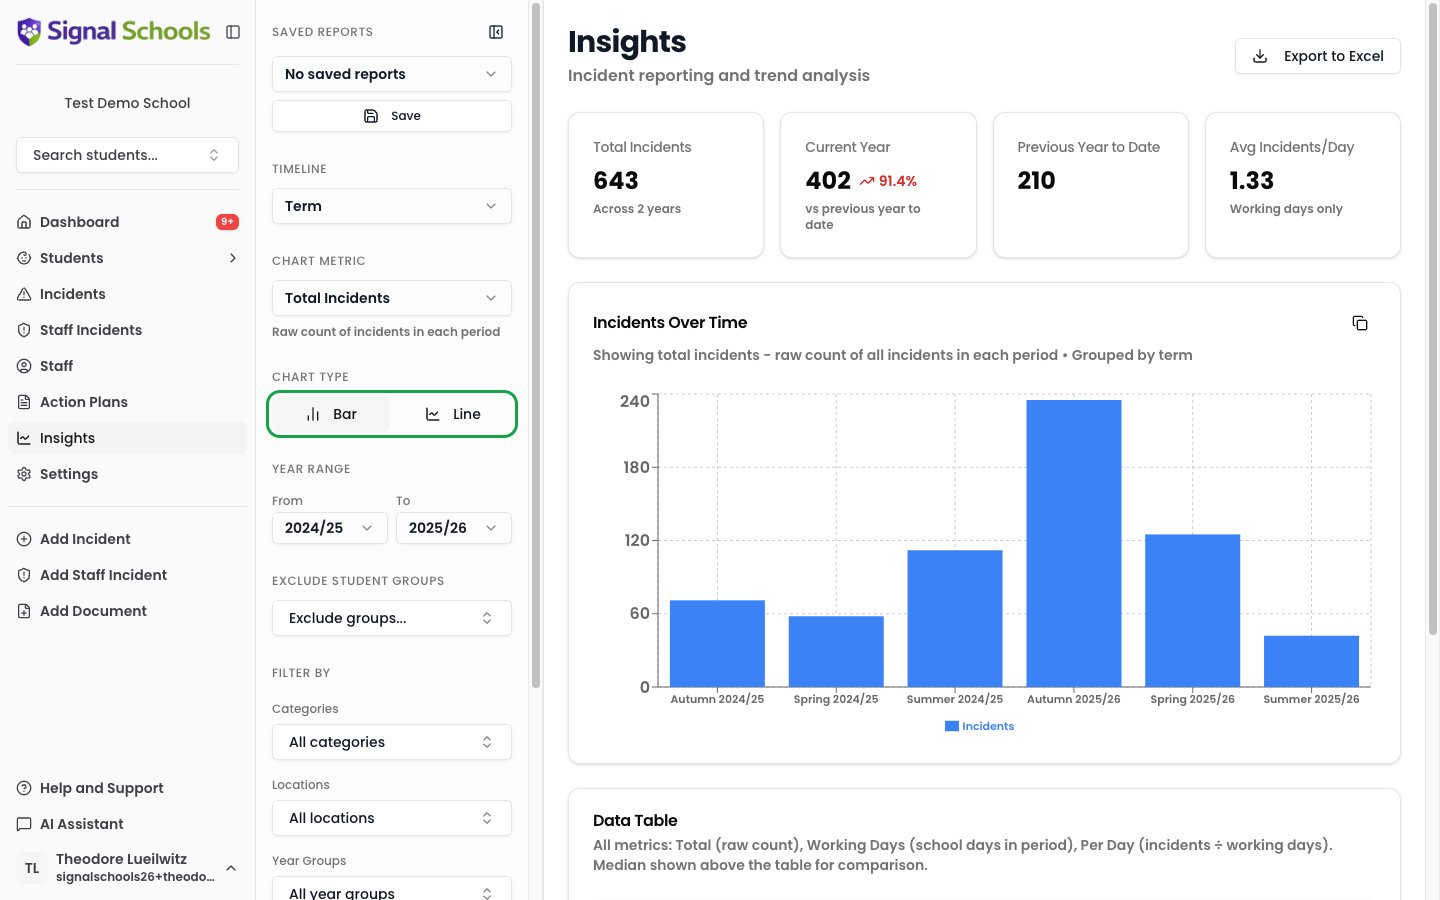
* **Bar chart** — best for comparing categories or time periods side by side.
* **Line chart** — best for showing trends and changes over time. Enable stacking for a filled area view that shows volume and proportions.
Choose the chart type that communicates your data most clearly for your audience.
## Filtering data
Start by narrowing down to the data you want to report on:
* **Year range** — select the academic years to include using the **From** and **To** year pickers, such as from 2023/24 to 2025/26.
* **Date range** — narrow further to a specific time period within those years, such as a term, half-term, or custom dates.
* **Categories** — include only specific types of concern, or leave blank to include all categories.
* **Year groups** — focus on particular year groups or compare across the school.
* **Student groups** — report on specific groups, such as Pupil Premium, SEN, or Children in Care.
Combine filters to answer specific reporting questions. For example, select "Autumn Term" + "Neglect" + "Year 3" to see neglect incidents for Year 3 during the autumn term.
## Chart types
Toggle between two visualisation styles to find the most effective presentation:
* **Bar chart** — best for comparing categories or time periods side by side.
* **Line chart** — best for showing trends and changes over time. Enable stacking for a filled area view that shows volume and proportions.
Choose the chart type that communicates your data most clearly for your audience.
 ## Exporting data
Click **Export to Excel** to download your filtered data as a multi-sheet Excel file. The export includes:
* The raw data behind your charts, organised into clear spreadsheet tabs.
* Summary information including the filters you applied and the date range covered.
Excel exports are ideal for including in governor reports, sharing with the local authority, or keeping as part of your safeguarding documentation.
## Saved reports
If you regularly produce the same reports — termly Ofsted preparation, half-termly governor updates, or monthly category reviews — you can save your filter and chart configurations for instant reuse.
### Creating a saved report
Apply the filters and choose the chart type that matches the report you want to save.
Click **Save Report** and give it a descriptive name, such as "Autumn Term Governor Report" or "Monthly Neglect Overview."
### Loading a saved report
Open your saved reports list and select the one you need. Signal applies the saved filters and chart settings, updating the data to reflect the latest records. Your saved configuration loads instantly — no need to remember which filters to apply each time.
### Sharing chart images
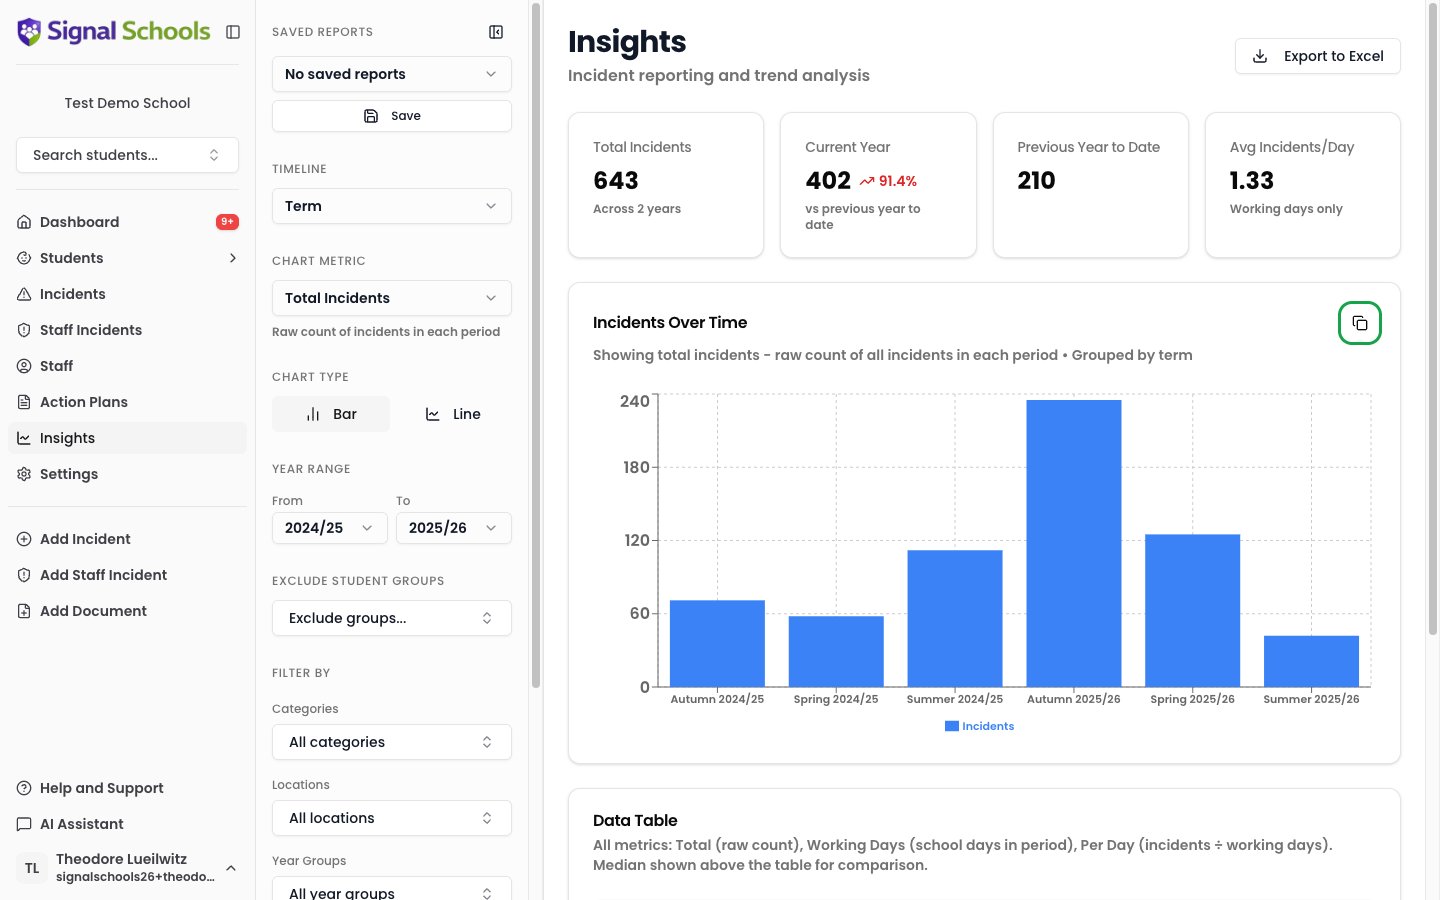
You can copy a chart image to your clipboard for pasting into presentations, emails, or documents. This is useful when you need a visual to include in a PowerPoint for governors or an email to your trust.
## Exporting data
Click **Export to Excel** to download your filtered data as a multi-sheet Excel file. The export includes:
* The raw data behind your charts, organised into clear spreadsheet tabs.
* Summary information including the filters you applied and the date range covered.
Excel exports are ideal for including in governor reports, sharing with the local authority, or keeping as part of your safeguarding documentation.
## Saved reports
If you regularly produce the same reports — termly Ofsted preparation, half-termly governor updates, or monthly category reviews — you can save your filter and chart configurations for instant reuse.
### Creating a saved report
Apply the filters and choose the chart type that matches the report you want to save.
Click **Save Report** and give it a descriptive name, such as "Autumn Term Governor Report" or "Monthly Neglect Overview."
### Loading a saved report
Open your saved reports list and select the one you need. Signal applies the saved filters and chart settings, updating the data to reflect the latest records. Your saved configuration loads instantly — no need to remember which filters to apply each time.
### Sharing chart images
You can copy a chart image to your clipboard for pasting into presentations, emails, or documents. This is useful when you need a visual to include in a PowerPoint for governors or an email to your trust.
 Save your standard reports — termly Ofsted prep, governor reports, and monthly reviews — so you can pull them up in seconds. The data updates automatically each time you load a saved report.