
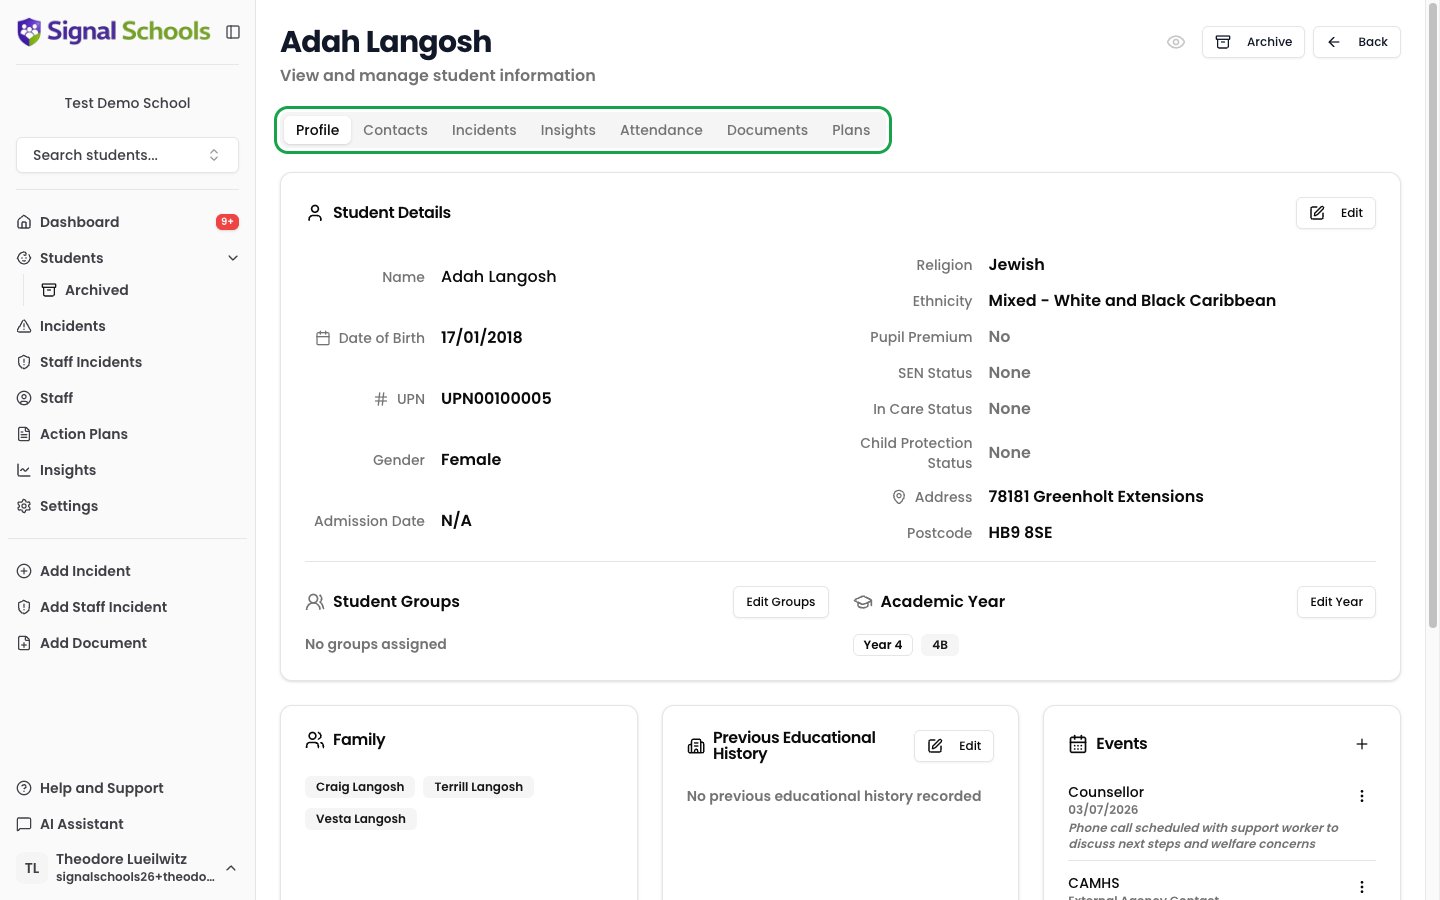
Profile tabs
The student profile is organised into tabs, each showing a different aspect of the student’s record. Profile and Contacts are shown to everyone who can open a profile; the remaining tabs need the Contributor role or above. Staff with the Reporter role cannot open student profiles at all — they can pick a pupil when recording a concern, but not browse their history.Profile
Personal details, demographics, year group, class, SEN status, and Pupil Premium eligibility — and the class notes written about this child.
Contacts
Parent and carer information, including relationships, phone numbers, and email addresses.
Incidents
All incidents linked to this student, including both incidents where the student is the main subject and incidents where they are a linked student.
Insights
A chronological safeguarding history across all activity related to this student — incidents, comments, documents, and actions displayed in date order — plus a relationship graph of the other children they share incidents with.
Attendance
Attendance data synced from your MIS, used by Signal’s AI for pattern analysis and trend identification. This tab appears only for Deputy DSLs and above, and only once your MIS is connected.
Documents
The student’s document library. Upload, view, and manage files such as reports, letters, assessments, and photos — independent of any specific incident.
Plans
Linked action plans for this student, including active and completed plans with their associated monitors and review history.
The Insights tab
The Insights tab holds the student’s timeline — a chronological history of all safeguarding activity related to the student. Each entry shows the date, a summary of the activity, the categories involved, and who created the record. The timeline makes it easy to see the full picture at a glance — you can quickly identify patterns, escalating concerns, or gaps in reporting without reading each incident individually.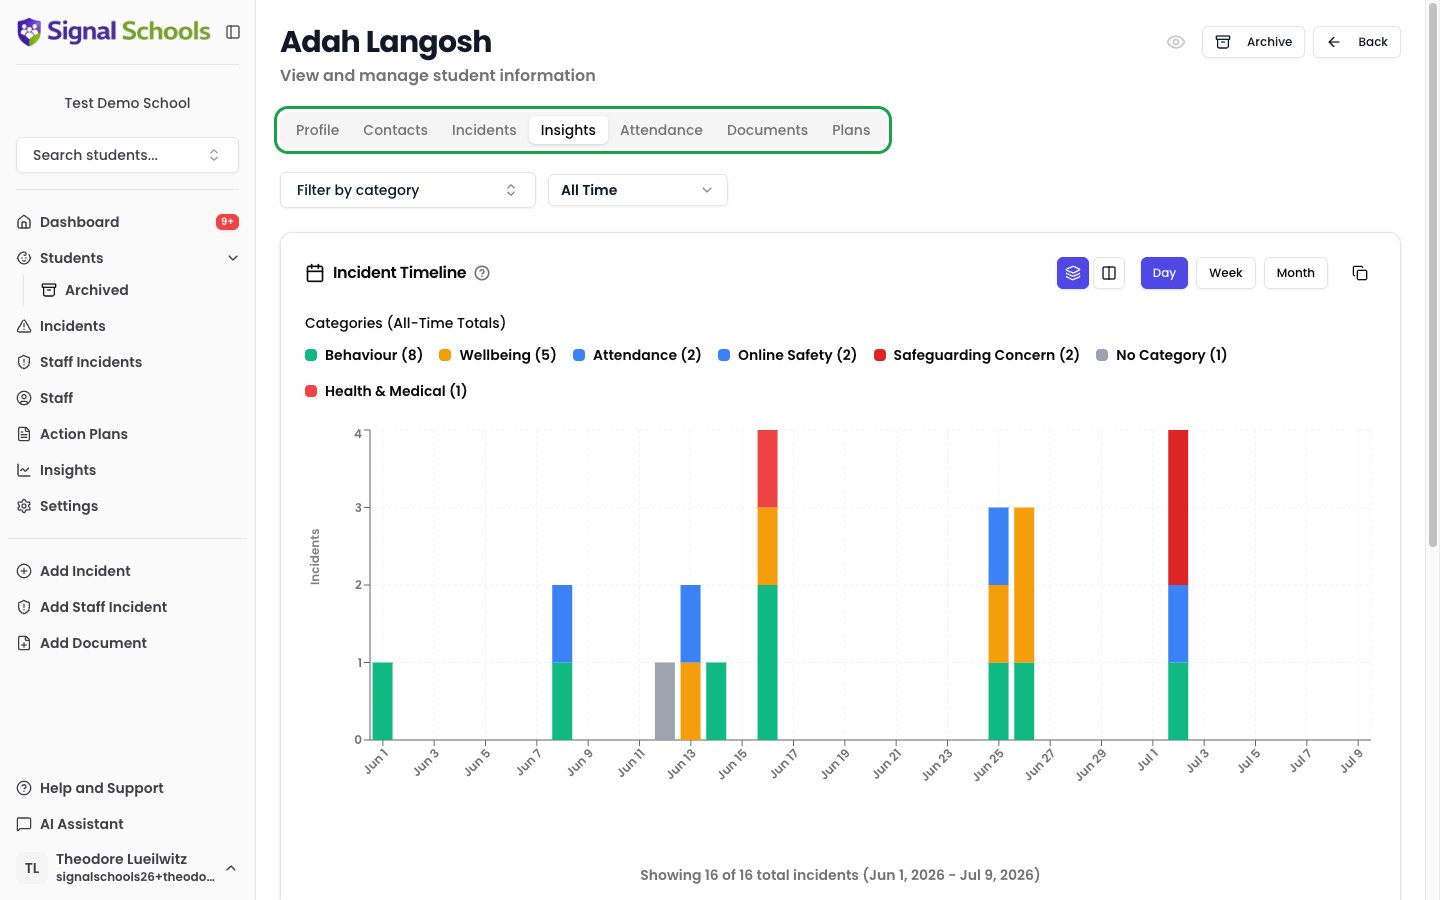
Family incidents on a student’s record
Some incidents on a student’s record were not recorded against that child at all. When a record is marked as a family incident — something that concerns the household rather than one pupil — it appears on the record of every sibling at your school. You can tell these apart at a glance: the card shows the name of the pupil the incident was recorded against, alongside a Family Incident badge.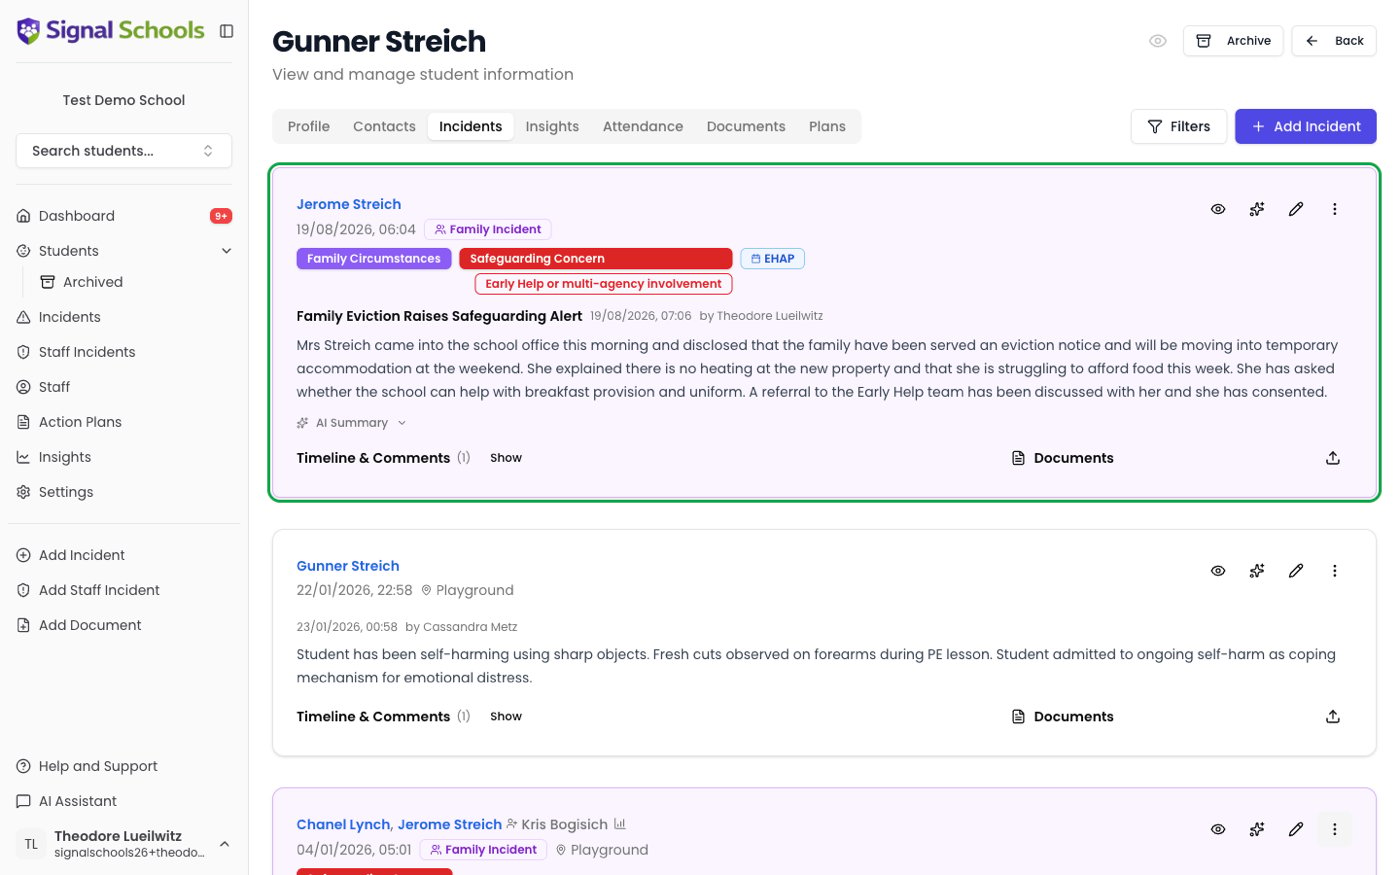
Relationship graph
Below the timeline chart, the Incident Relationships graph shows which other children this student has appeared in incidents alongside. It is the fastest way to see whether concerns about a child sit on their own or run through a wider group. The student you are viewing sits at the centre. Everyone they share incidents with is arranged in rings around them, and the children who share the most incidents sit closest to the centre — so the strongest connections are the ones your eye lands on first.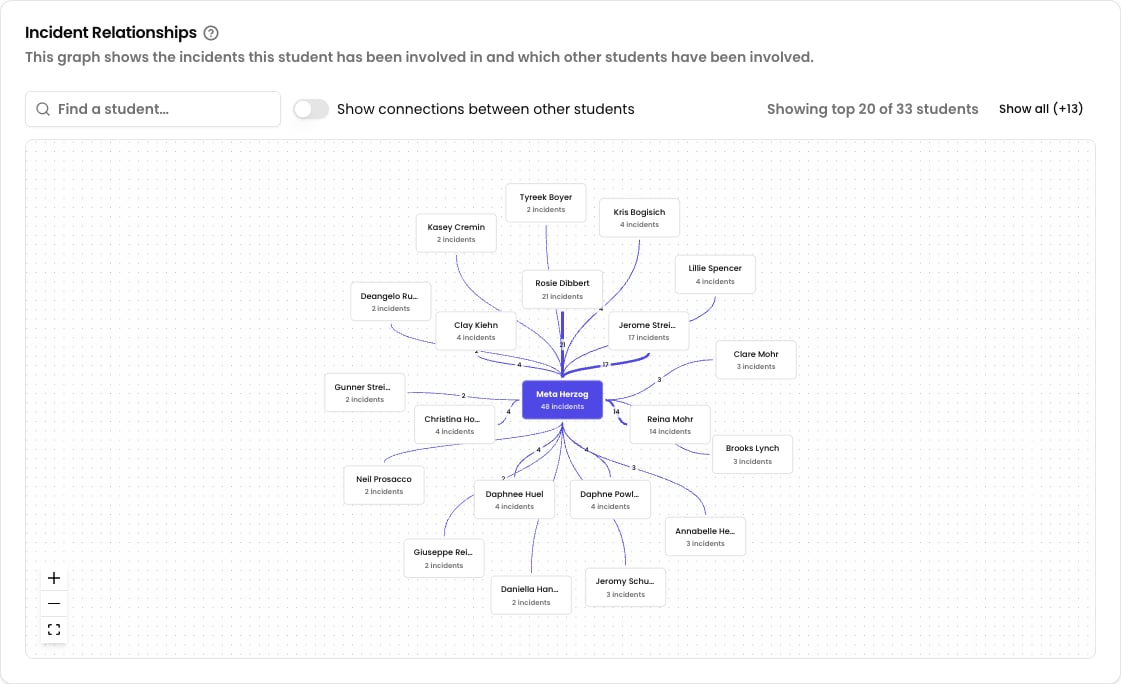
How to read it
- Coloured lines run from the centre to each student who shares incidents with them.
- Grey lines run between the other students, showing where those children share incidents with each other rather than with the student you are viewing.
- Line thickness shows how many incidents are shared — the thicker the line, the more they have in common.
- The number on each line is the count of shared incidents.
- The number under each name is how many incidents that child shares with the student at the centre.
Exploring the graph
1
Hover a student to isolate them
Move your pointer over any student and everyone they are not connected to fades away, leaving just that child’s own web of connections.
2
Click a line or a student to see the incidents
Click any connecting line, or any student in the ring, to open the list of incidents those two children share.
3
Search for a specific child
Type a name into Find a student… above the graph. Pick a result and the graph pans to that child and highlights them briefly. Press Enter to jump straight to the first match.
Keeping a busy graph readable
A child involved in a lot of group incidents can be connected to dozens of others. Two controls keep that readable:- Show connections between other students — turn this off to hide the grey lines between the other children and leave only the connections to the student at the centre. For larger groups Signal turns these off for you to begin with; switch it on whenever you want the full web back.
- Show all — by default the graph shows the top 20 most-connected students, and tells you how many are hidden. Click Show all to bring in the rest, or Show top 20 to go back.
The graph respects the filters you have set on the timeline above it. Narrow the date range or select particular categories and the graph redraws to match, so you can ask questions like “who has this child been involved with on physical incidents this term?”
Student restrictions
Student restrictions stop an individual member of staff from seeing everything about a particular child — their profile, incidents, documents, and alerts. Restrictions are configured on the staff member’s page, not the student profile, and are the right control for cases where the sensitivity is tied to a person, such as a member of staff who is a relative of a child. Student restrictions are one of three ways to control who can see safeguarding records. For how to set them up, when to use each control, and how they combine, see Managing incident visibility.Applying or managing student restrictions requires Deputy DSL or above.
Related pages
Adding & Editing Students
Add students manually or through MIS sync.
Student Groups
Organise students into groups for filtering, alerts, and reporting.